Continuing the story of calculating energy use and the pitfalls of the NatHERS energy rating system
Readers may recall that our official NatHERS rating was a disappointing 7.7 Stars. But after living in the house for a while it felt that this was too low. Actual calculations from our electricity power bills, converted to comparable figures*, gave a more realistic rating nearer to what we expected for summer, but not winter.
After PV installation:
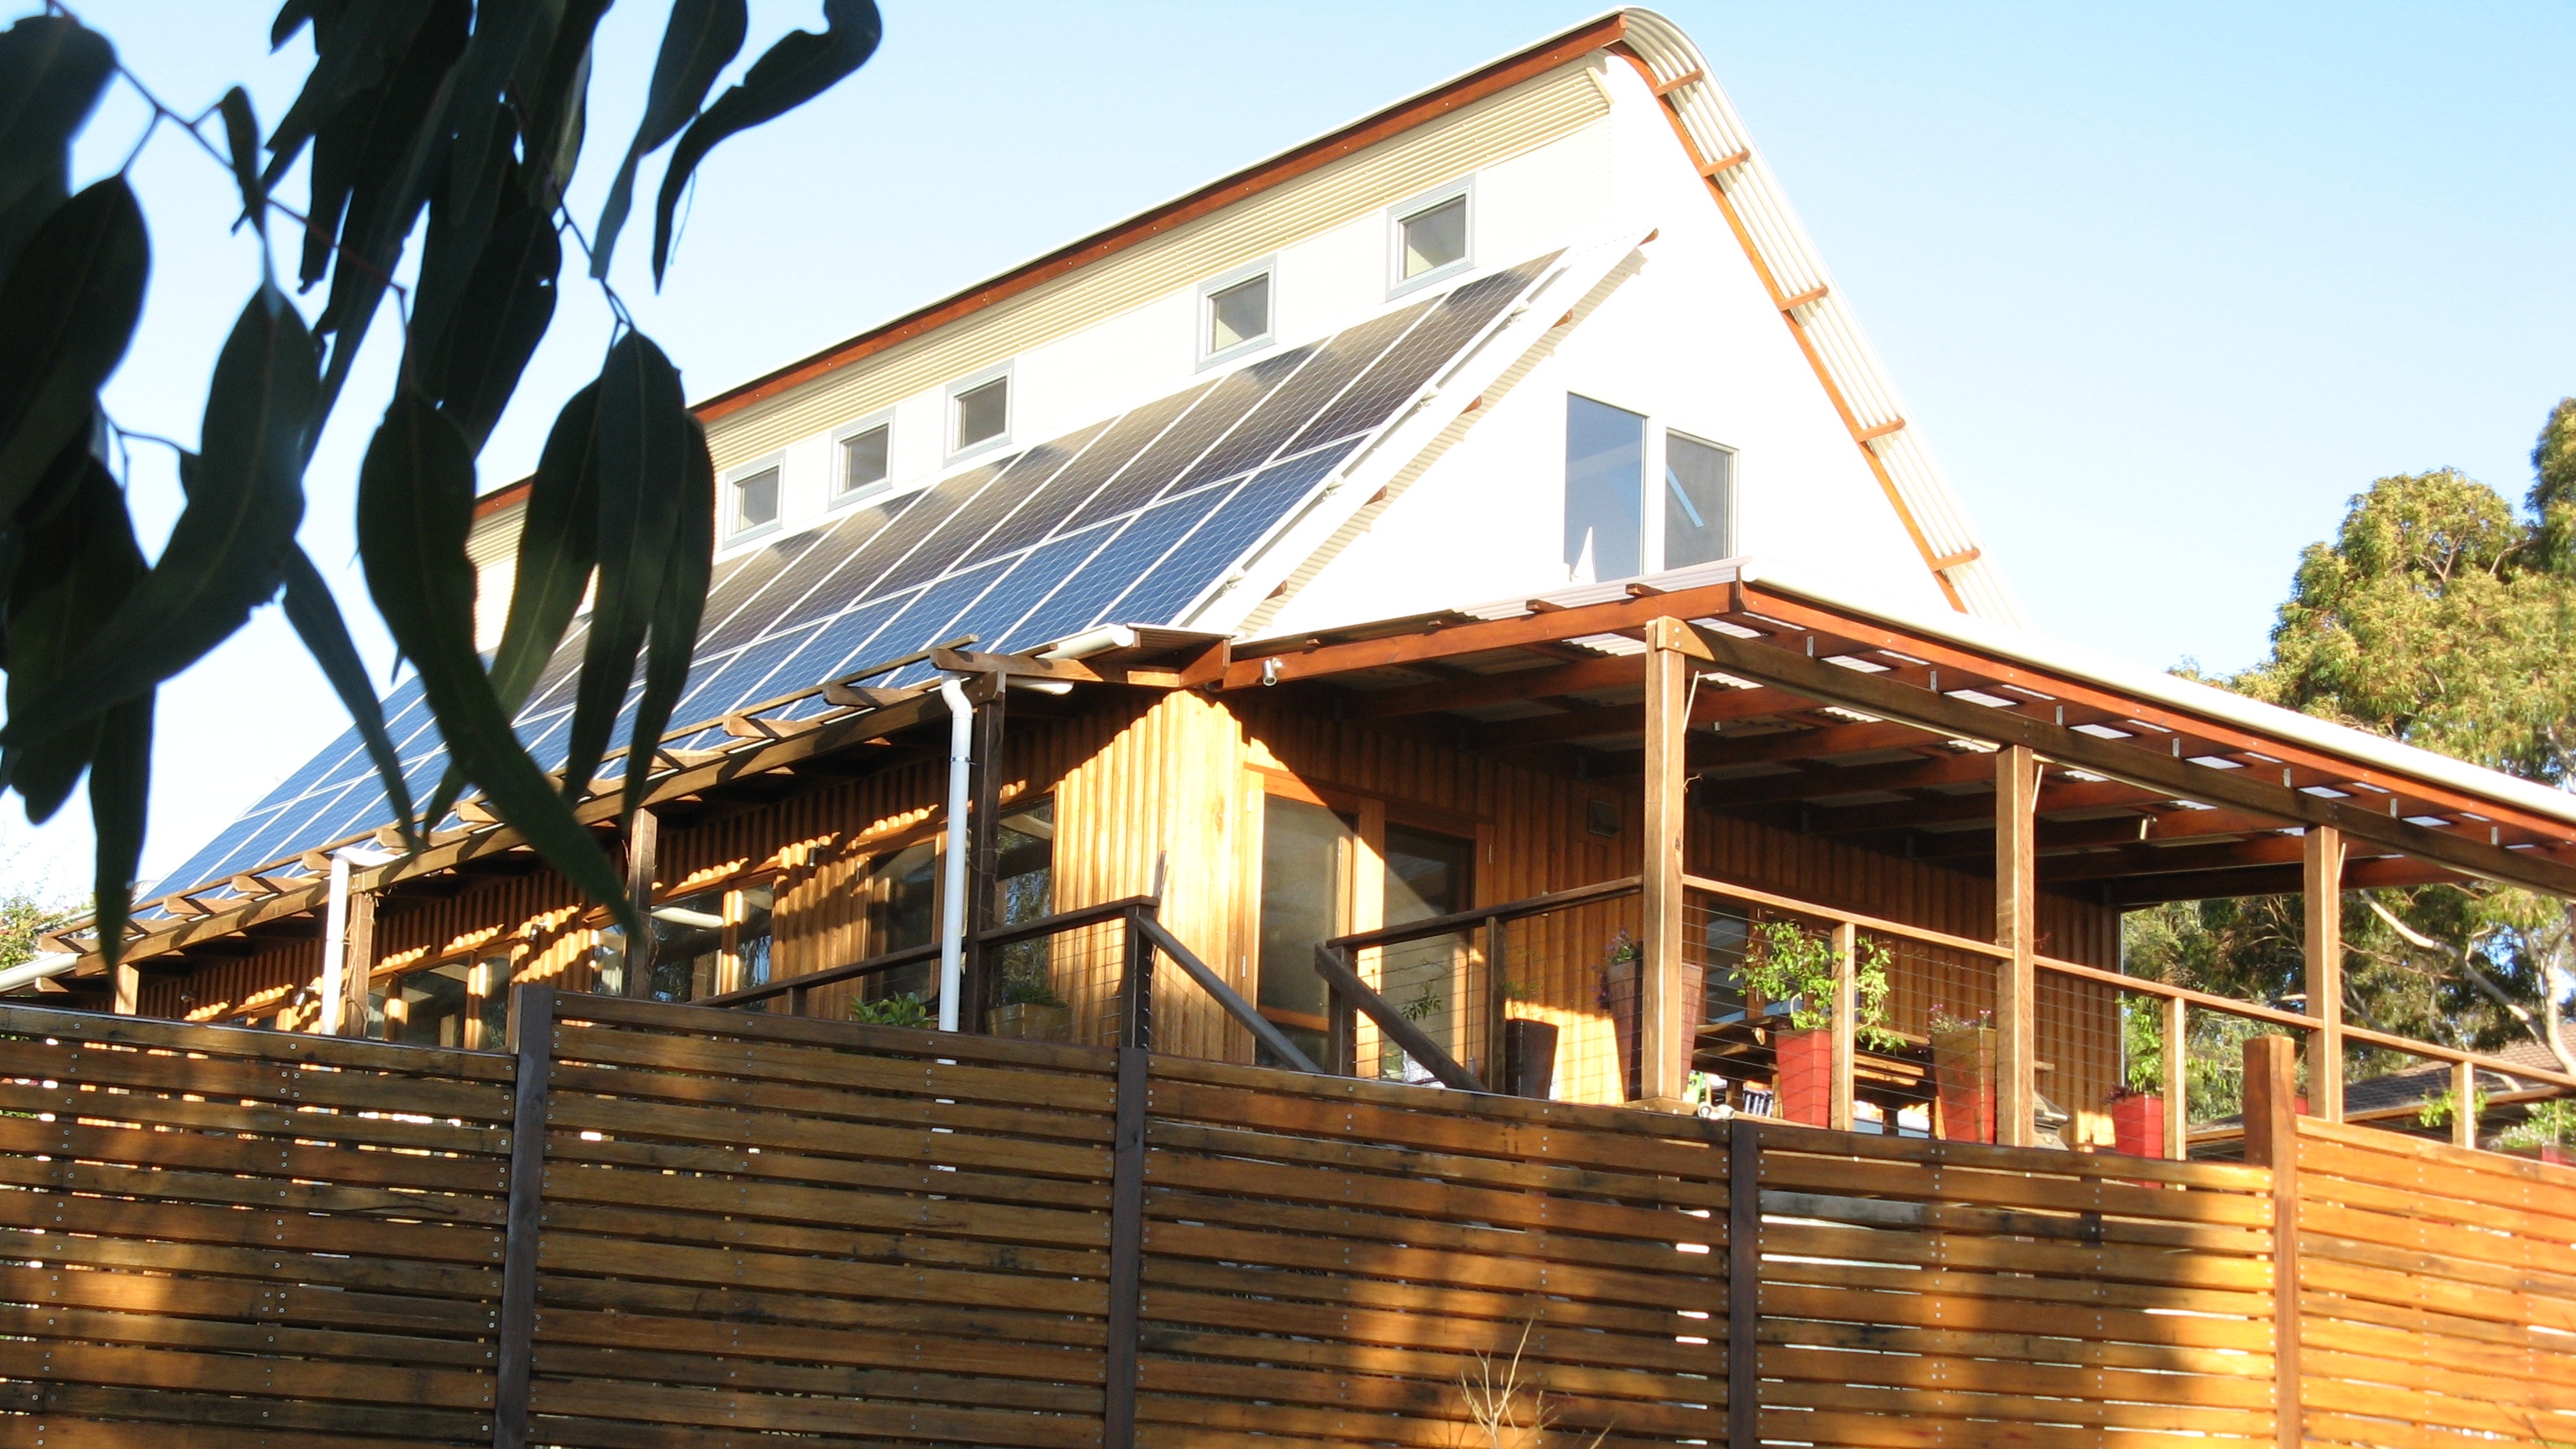
Our long awaited and planned for solar panel PV system was installed in early winter 2018. Soon after the heat pump hot water system was switched over from night to daytime heating to take advantage of our own electricity production. This gave a much better figure for heating – 8.6 Stars.
In the following spring 2018 and summer of 2019 we averaged very low energy use and taking out the basal figure gave a negative energy usage and thus a meaningless rating. In effect the energy used for living and cooling the house was all generated by the sun and thus a maximum 10 Stars could be claimed!
We could average these 2 ratings at just over 9 Stars which would be nice! And the $ value is another story.
We have now, (winter 2019), made other changes such as window pelmets, honeycomb blinds and a reverse cycle air conditioner, which we are using mainly during the day, to ‘pre-warm’ the house.
At our courses we will give full details of how we manage these things and participants will be updated regularly, if they want.
Notes:
*I used a conversion factor of 3.6 to convert 1 kilowatt hour (kWhr) to the equivalent 3.6 mega joules (mJ).
And the formula (billed minus basal) kWhr x 3.6 x 365/2 or 182.5 days divided by 150 m2 (the conditioned area of our home) gives the answer in mJ/ m2 per heating or cooling period – which are totalled per annum. Using the NatHERS table for Adelaide mJ/m2 is converted to a star rating out of 10.